
Want more insights about how your Google Web Stories are performing? Google has the Data Studio report you need.
Web Stories are visual, tappable full-screen mobile stories that can be found via Google Search and Discover.
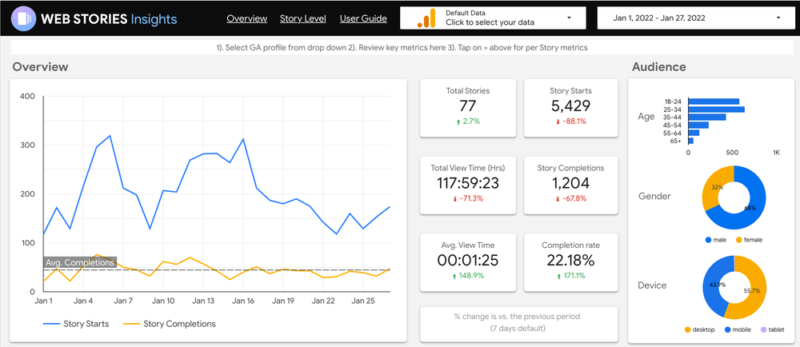
Metrics you can view in Web Stories Insights Dashboard. There are two main tabs: Overview and Story Level. Among the metrics you can view on this dashboard:
- Key Metrics: Story starts, page views, time spent and completion rate (number of story completions divided by story starts).
- Audience Metrics: Age, gender and device.
- Top Stories: Your top 10 stories during a selected time period, sorted by Story Starts.
- Traffic Channels: An overview of how users have found and read your Web Stories – organic search, direct (which includes Discover), referral, social, email, or custom.
- Story Level Performance: Key metrics and a breakdown of pageviews for a specific story.
For this template to work, you’ll first need to set up tracking for your Web Stories in Google Analytics (or another analytics provider). For whatever editor you use to create Web Stories, you’ll need to provide your UA Tracking ID. After you’ve done this, you can view performance metrics by navigating to Behavior > Events > Overview.
Then you’ll be able to see metrics including story starts, time spent, story pages viewed and story completions:

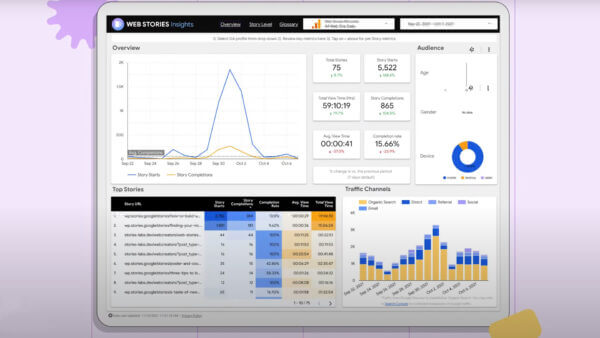
What the Web Stories Insights Dashboard looks like. This:
How to get the dashboard. You can access the dashboard here.
Once you get there, simply select your analytics account from the dropdown to see your data. Also, you can copy the template and customize it to your liking.
For more information, you can check out this blog post. Google also shared a video that walks you through setting up and using the dashboard.

Why we care. Data is king. This template provides a visual overview to help determine how well your Google Web Stories are performing. You can see how engaging your content is and how people are finding your stories. Tracking the performance of any content you’re investing time and resources into is essential.